How does Vietnam’s GNI per capita compare to Singapore and Thailand?
The income index is calculated from GNI according to purchasing power parity per capita. Data on WB use purchasing power parity in current USD (USD – PPP).
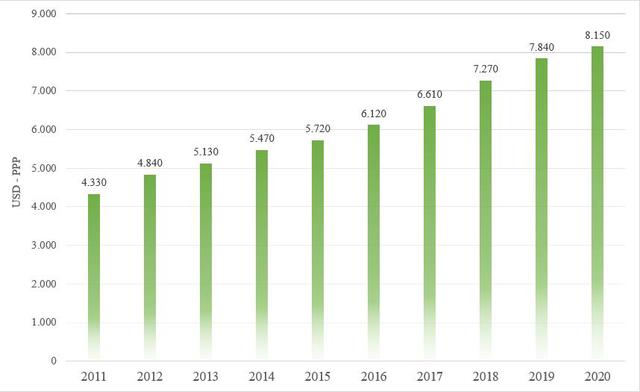
Accordingly, the WB gave Average GNI per capita of Vietnam in 2011 was 4,330 USD – PPP, in 2015 it was 5,720 USD – PPP. By 2020, this number is up to 8,150 USD – PPP.

GNI per capita in Vietnam from 2011 to 2020. Source: WB
In 2020, Vietnam’s GNI per capita nearly doubled compared to 2011. In the period from 2011 to 2020, the average GNI per capita increased by 7% per year. In which, the year with the largest increase was 2012, an increase of 12% compared to 2011. The year GNI per capita increased the least during this period was 2020, an increase of 4% due to the impact of Covid-19.
According to the General Statistics Office of Vietnam, despite high growth, Vietnam’s GNI per capita in 2017 was only 30% of the general average of Southeast Asia, 33.3% in 2018 and equal to 2019 34.9%.
According to the Human Development Index report of the General Statistics Office, the income index of the whole country in 2016 reached 0.624, in 2017 reached 0.634, an increase of 1.6% compared to 2016. In 2018, the income index of Vietnam reached 0.648, in 2019 reached 0.659. By 2020, the national income index will reach 0.664, an increase of 0.76% over the previous year.
From 2016 to 2020, the national income index increased by 6.4%, an average annual increase of nearly 1.6%, more than twice the average growth rate of Southeast Asia. However, Vietnam’s income index in 2017 was only equal to 87.8% of the region’s average income index, 89.3% in 2018 and 89.9% in 2019.

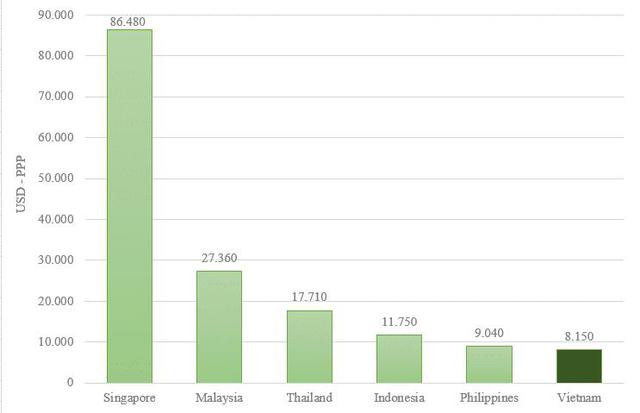
GNI per capita in USD – PPP in 2020 of Vietnam and some countries in the region. Source: WB
In the ASEAN-6 group, Singapore’s GNI per capita in 2020 reached nearly 90,000 USD – PPP, 10.6 times higher than Vietnam’s GNI per capita. Malaysia’s average GNI reached 27,360 USD – PPP, 3.3 times higher than Vietnam, Thailand reached 17,710 USD – PPP, 2.17 times, Indonesia reached 11,750 USD – PPP, 1.44 times higher and the Philippines reached 9,040 USD – PPP, 1.12 times higher than Vietnam.
According to the World Bank, Vietnam and the Philippines are in the lower middle income group, while Malaysia, Thailand and Indonesia are in the upper middle income group. Only Singapore is in the high-income group.
at Blogtuan.info – Source: Soha.vn – Read the original article here


